The Trend Analysis feature is a powerful tool that helps you track your volleyball performance over an entire season. By analyzing your statistics across multiple matches, you can identify patterns, measure consistency, and see how you've improved throughout the season.
Accessing Trend Analysis
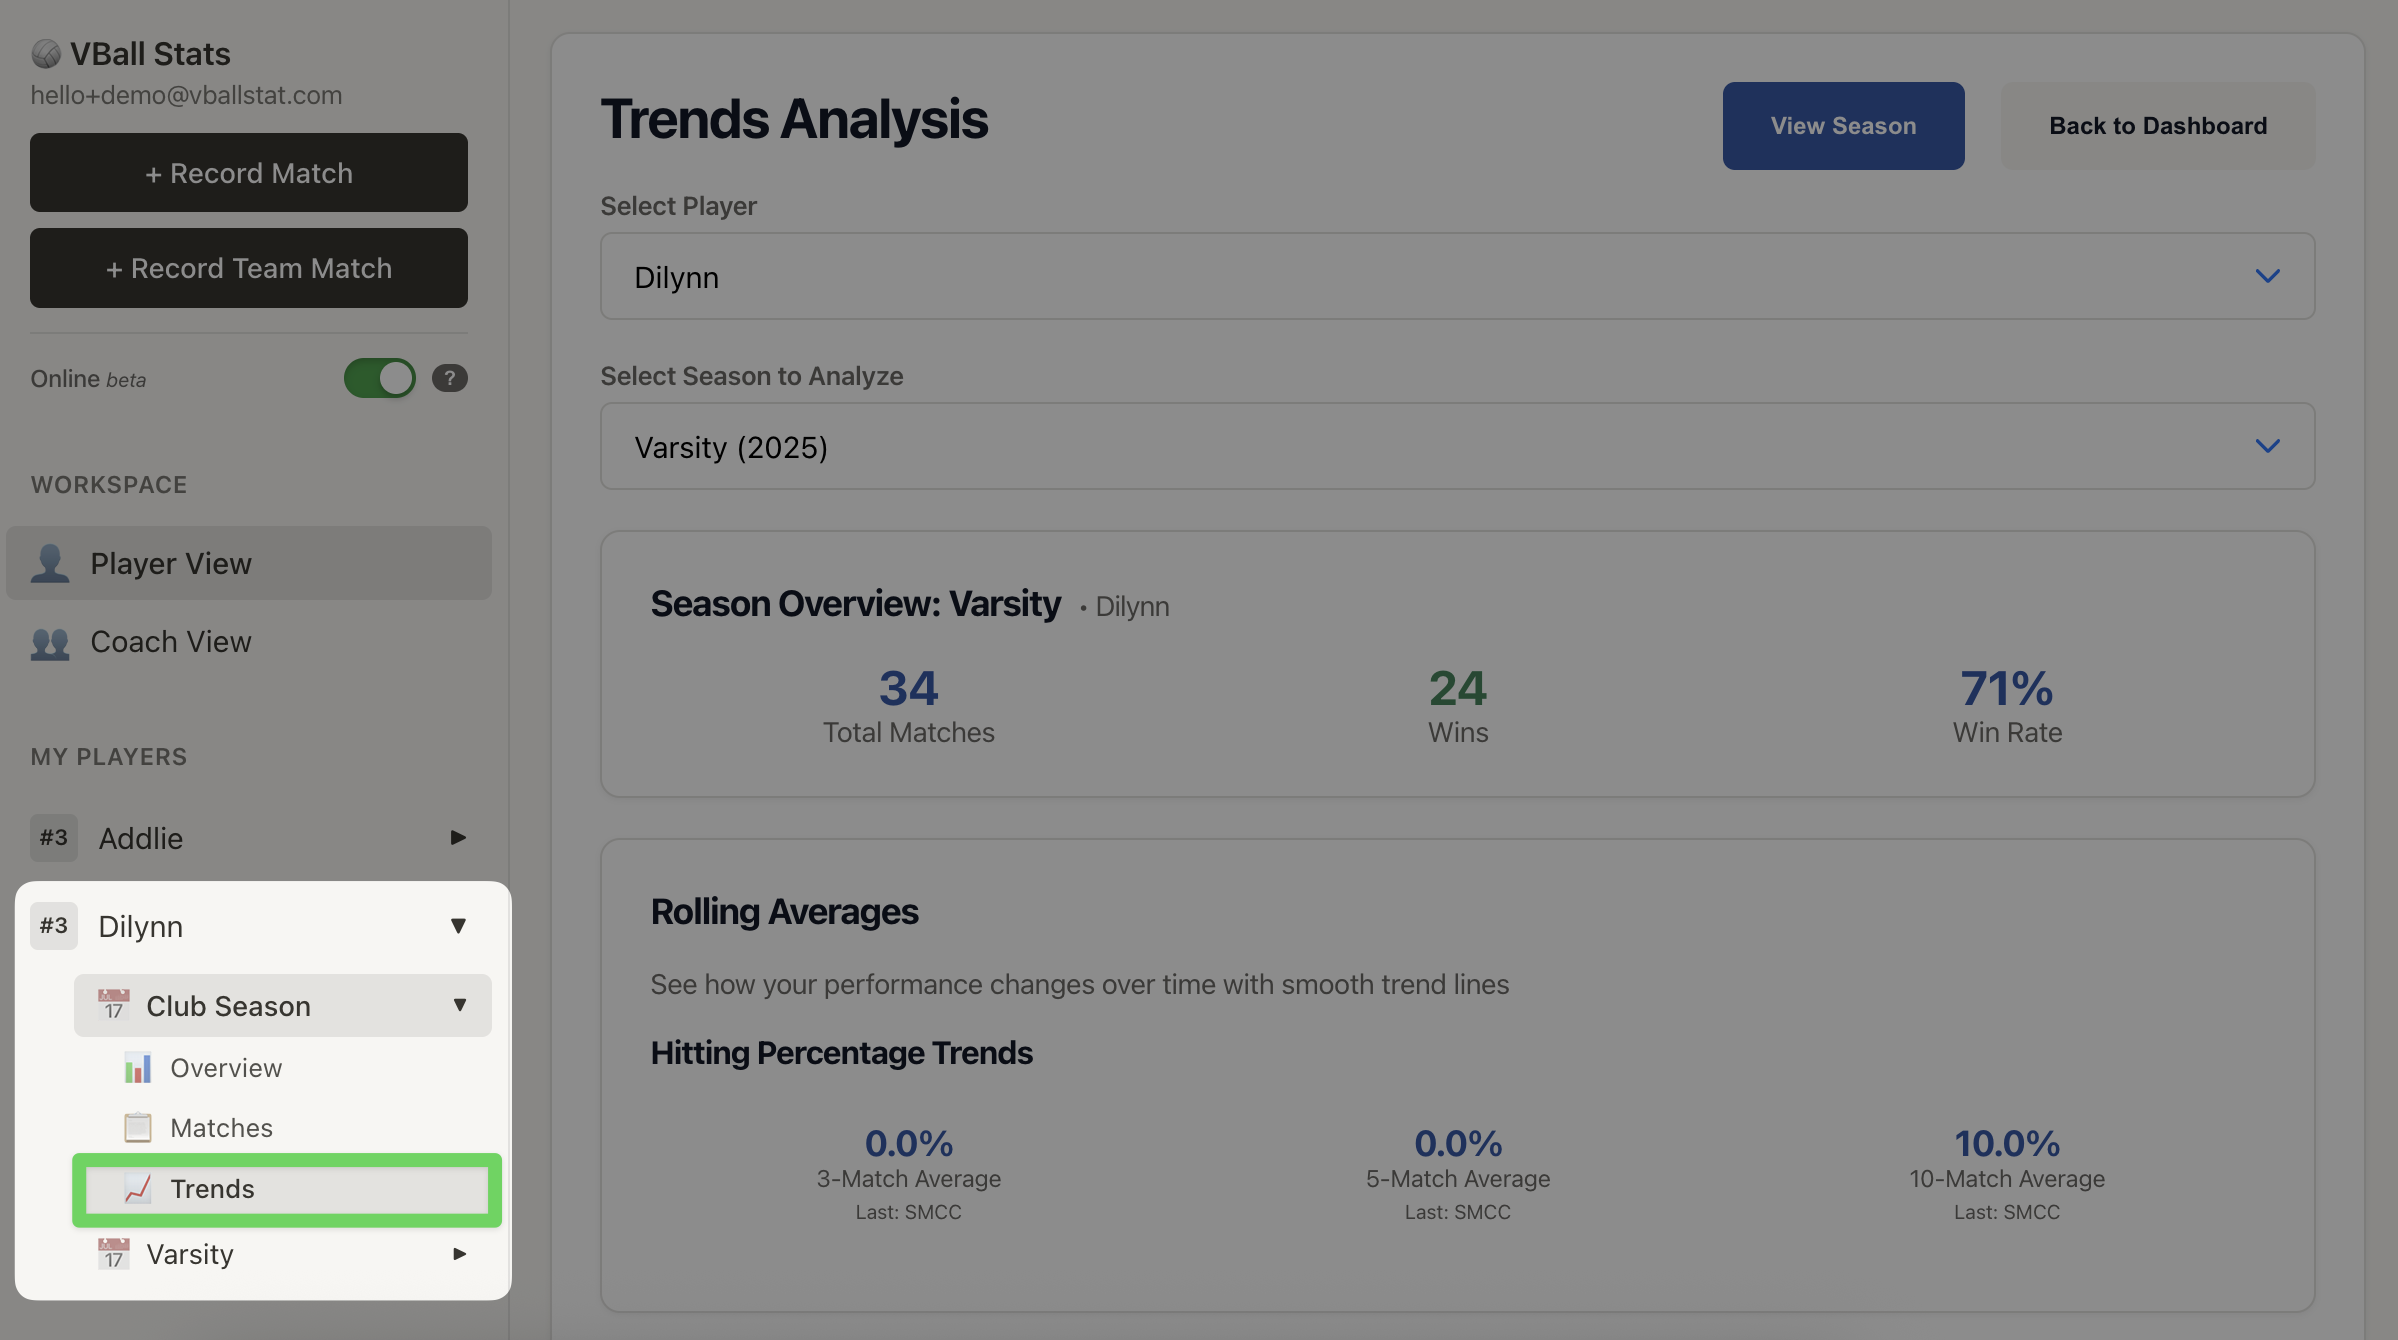
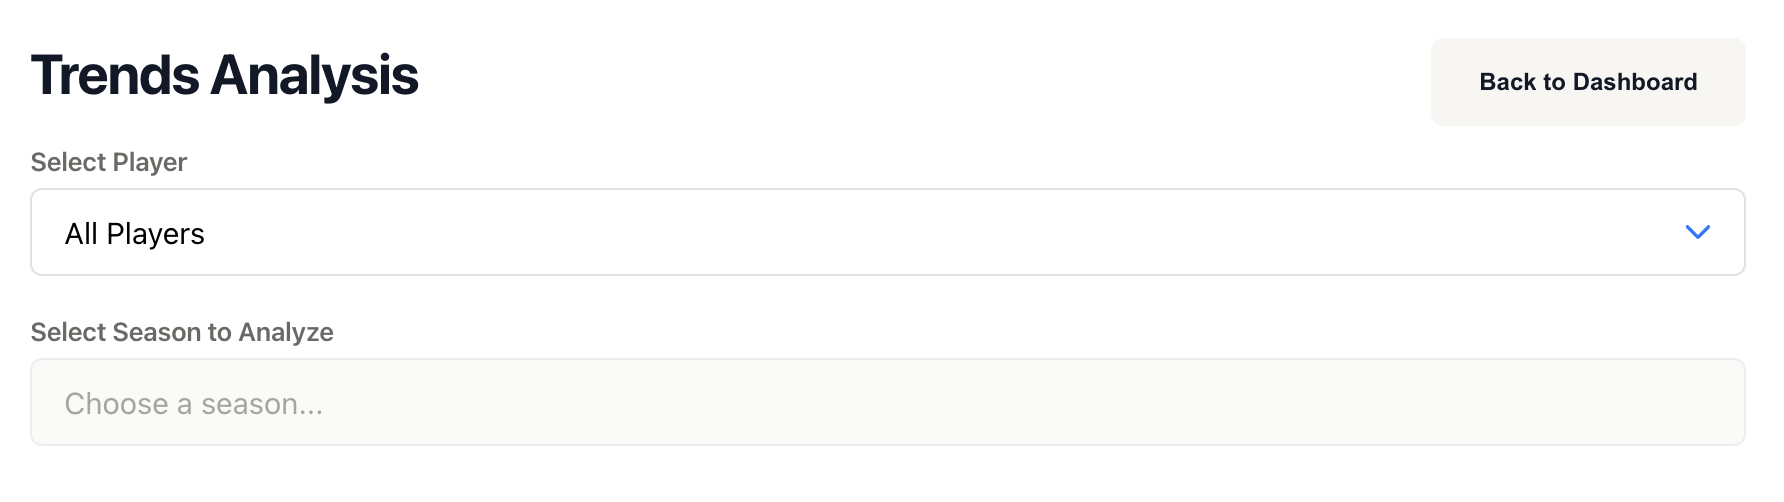
To view your trend analysis:
- Navigate to your Player Dashboard
- Select a player from your player list
- Select a season for that player
- Click on the Trends tab (📈/📉 icons)
What You'll See
The Trend Analysis page is organized into several key sections that provide different insights into your performance:
Season Overview
At the top of the page, you'll see a summary of your season including:
- Total Matches - Number of matches played this season
- Total Wins - Number of matches won
- Win Rate - Your winning percentage

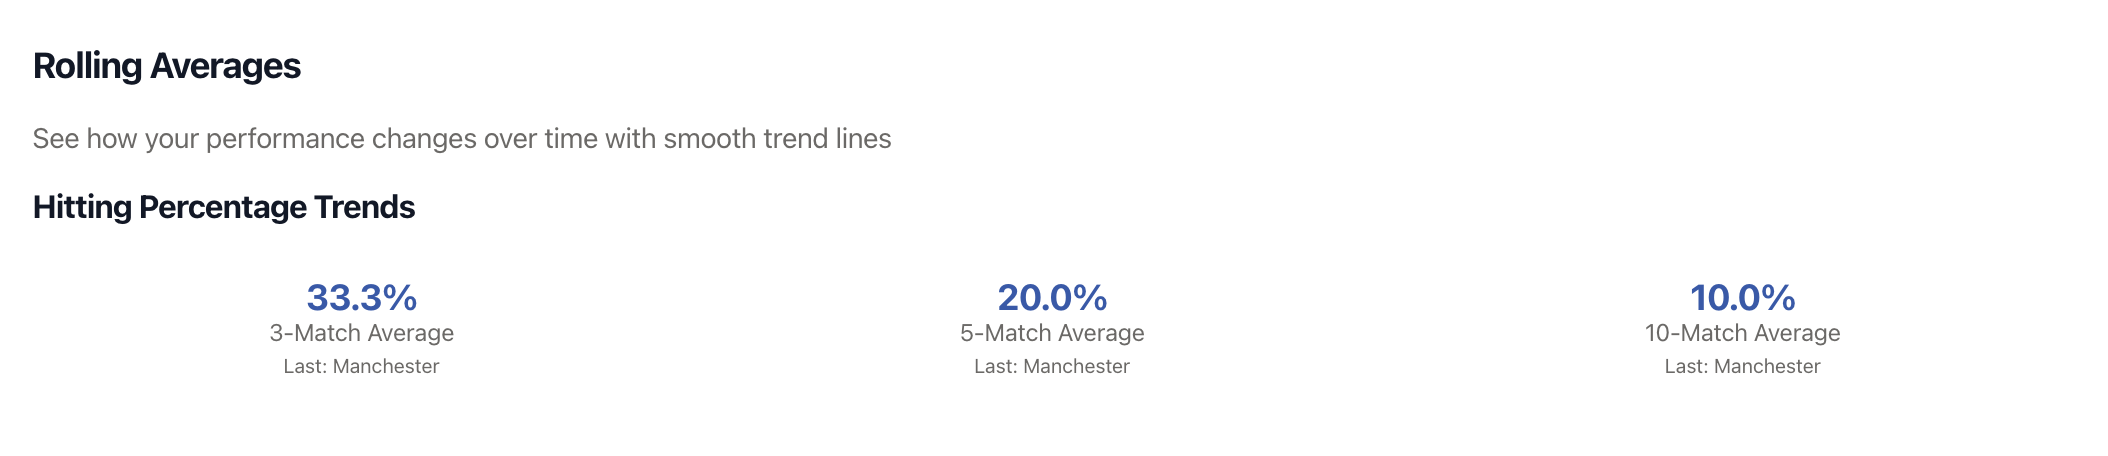
Rolling Averages
This section shows your Hitting Percentage averaged over different time windows to smooth out match-to-match variations:
- 3-Match Average - Your hitting % over your last 3 matches
- 5-Match Average - Your hitting % over your last 5 matches
- 10-Match Average - Your hitting % over your last 10 matches
Each average shows the most recent value and identifies the opponent from the last match included in that window. This helps you understand short-term trends versus longer-term performance patterns.
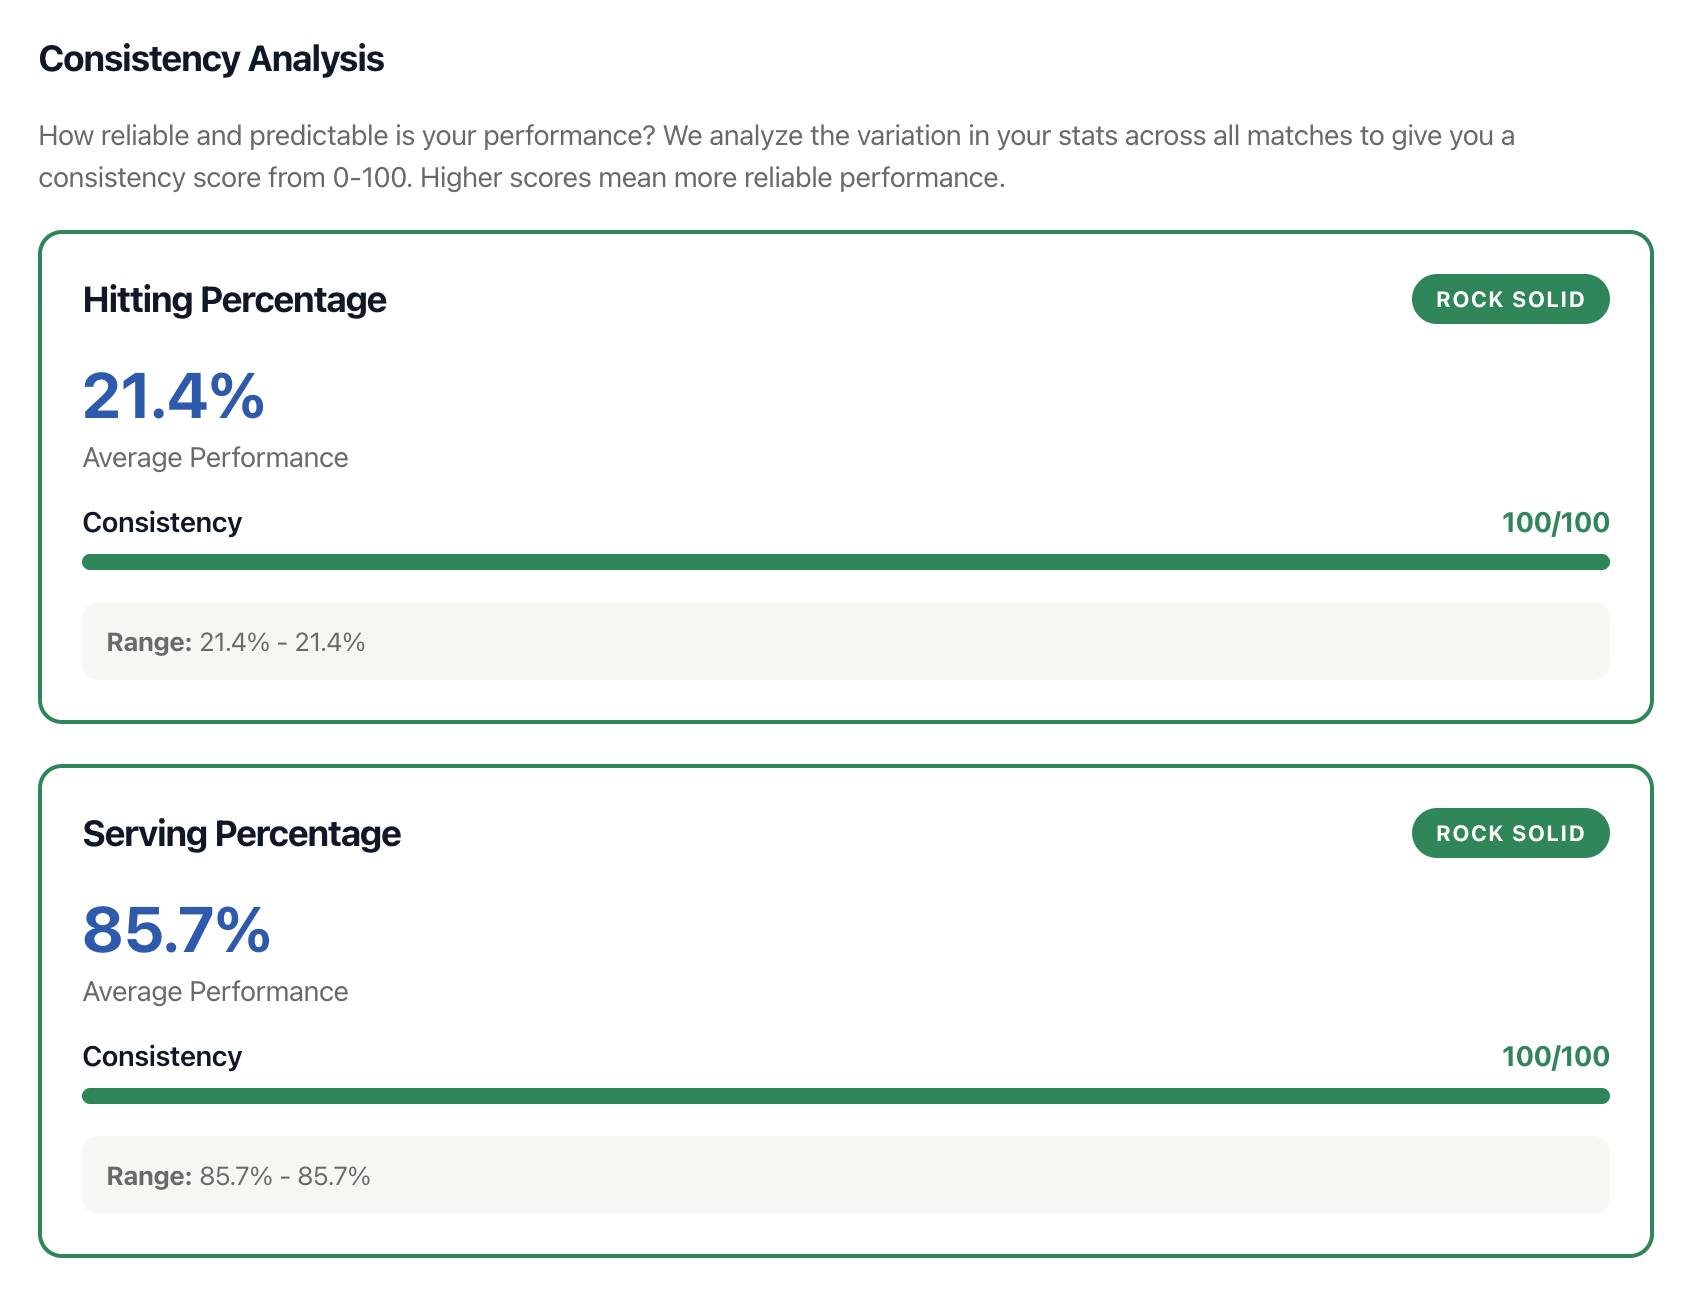
Consistency Analysis
This section measures how reliable your performance is from match to match. Consistency is different from your average performance - you could have a high average but still be inconsistent if you have many ups and downs.
VBallStat analyzes consistency for two key metrics:
- Hitting Percentage Consistency
- Serving Percentage Consistency
For each metric, you'll see:
- Average Performance - Your mean performance across all matches
- Standard Deviation - How much your performance varies
- Consistency Score - A 0-100 rating of how reliable you are
- Range - Your best and worst performances
- Consistency Category - A label describing your consistency level
Consistency Categories
Your consistency score places you in one of five categories:
- Rock Solid (80-100) - Very reliable performance, rarely have off days
- Consistent (60-79) - Generally reliable with occasional fluctuations
- Variable (40-59) - Somewhat unpredictable, mix of good and bad matches
- Streaky (20-39) - Very unpredictable with hot and cold streaks
- Wild Card (0-19) - Extremely inconsistent, performance varies wildly
Performance Trends: Early Season vs Recent Matches
This section compares your performance in the first half of the season to your recent matches, helping you see if you're improving, declining, or staying steady.
The following statistics are compared side-by-side:
- Hitting Percentage
- Ace Percentage
- Serving Percentage
- Dig Percentage
- Assists per Match
- Blocks per Match
Each metric shows three values:
- Early Season - Your average from the first half of matches
- Change Indicator - Arrow showing if you improved (↗), declined (↘), or stayed the same (→)
- Recent Matches - Your average from the second half of matches
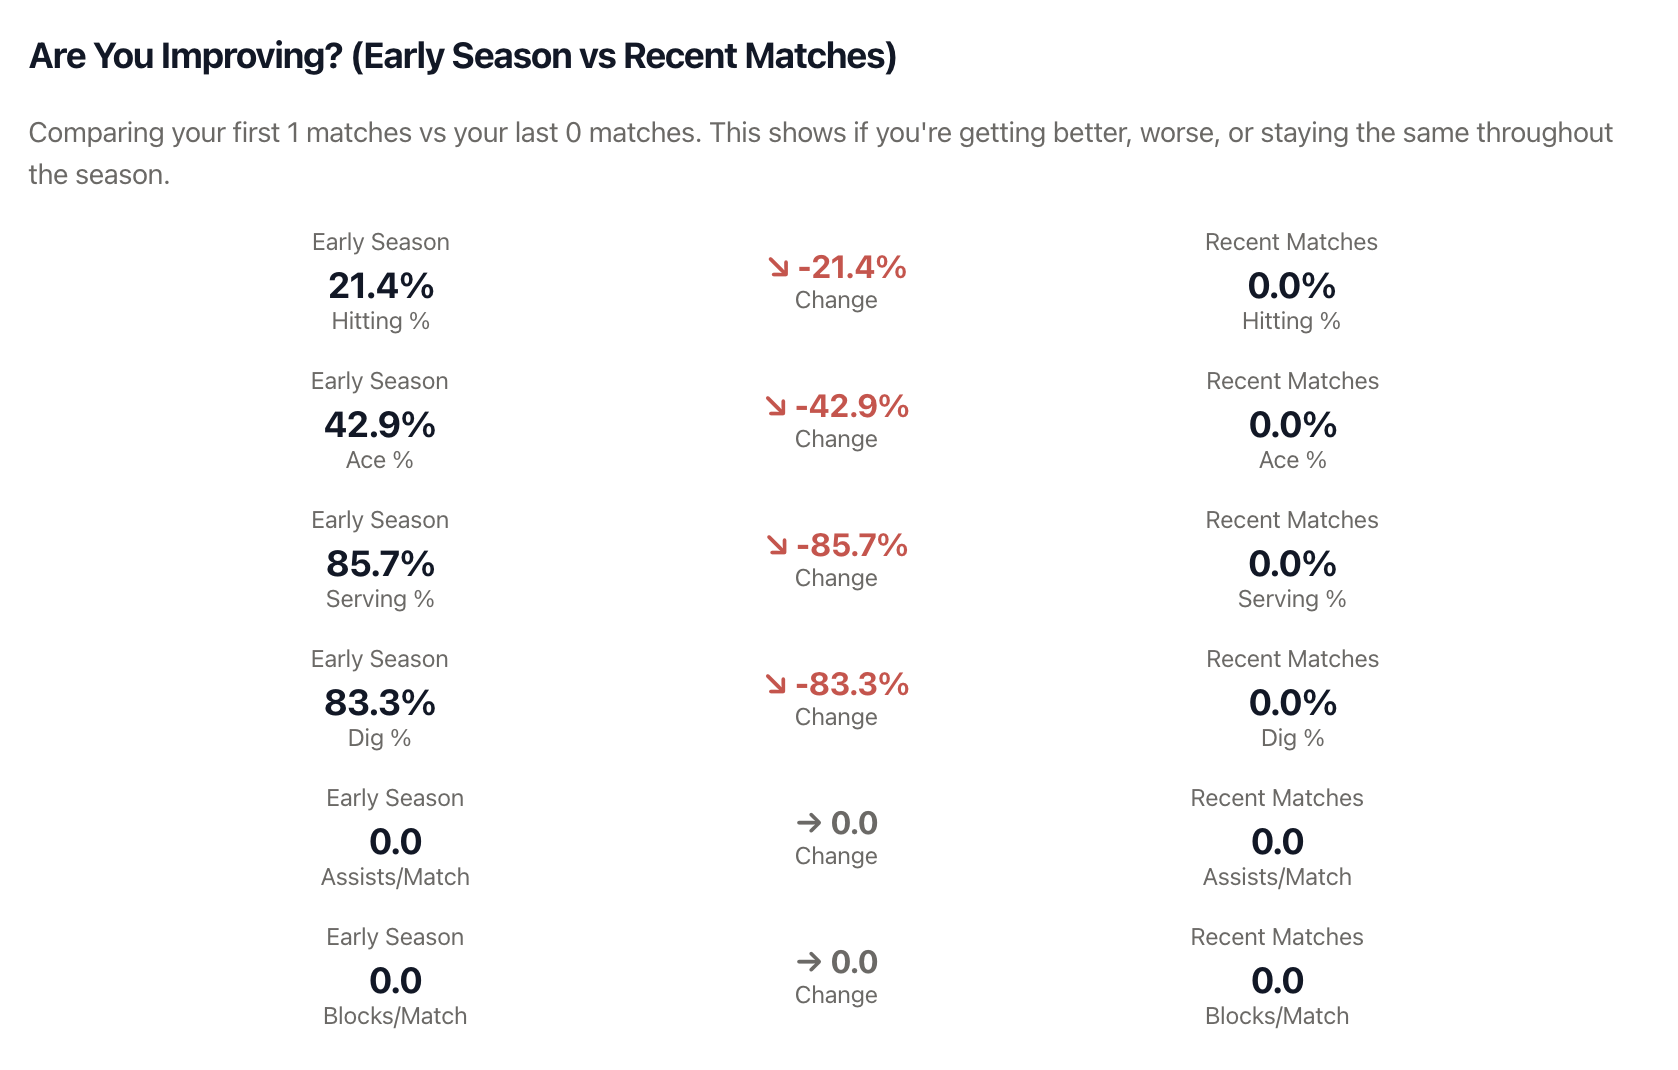
- ↗ Green Arrow = Improving (recent performance is better)
- ↘ Red Arrow = Declining (recent performance is lower)
- → Gray Arrow = Stable (no significant change)
Win Streak Analysis
Track your momentum with win streak statistics:
- Current Streak - Shows positive number for wins, negative for losses
- Longest Win Streak - Most consecutive wins this season
- Longest Loss Streak - Most consecutive losses this season
Filtering Your Data
By Player
Use the player dropdown at the top of the page to switch between different players. When you change players, you'll need to select a season for that player.
By Season
Select which season to analyze from the season dropdown. Only seasons where the selected player has recorded matches will appear in the list.
Note: Trend Analysis shows data for the entire selected season. There are no date range filters - all matches from that season are included in the analysis.
Using Trends to Improve Your Game
Focus on Consistency, Not Just Averages
A player with a .300 hitting percentage and "Rock Solid" consistency is often more valuable than a player with a .350 average but "Streaky" consistency. Use the consistency analysis to identify areas where you need to become more reliable.
Identify Which Half You Performed Better
If your early season performance was stronger than recent matches, this could indicate:
- Fatigue as the season progresses
- Tougher competition later in the season
- Need for renewed focus or different training
If recent matches show improvement:
- Training is working - keep it up!
- You're adapting well to competition
- Building momentum heading into playoffs
Use Rolling Averages to Track Short-Term Changes
If your 3-match average is significantly different from your 10-match average, you're experiencing a recent shift in performance. This helps you identify improvements or slumps quickly rather than waiting for end-of-season analysis.
Set Improvement Goals
Use your current trends as a baseline. For example:
- If your hitting percentage consistency is "Variable", aim to move it to "Consistent"
- If recent matches show declining serve percentage, make serving a practice focus
- If you're improving in most areas, maintain your training approach
Quick Navigation
From the Trends page, you can:
- View Season - Click to see detailed match-by-match results for the selected season
- Back to Dashboard - Return to your main player dashboard
Tips for Meaningful Analysis
- Record all matches - The more data you have, the more accurate your trends will be
- Check trends regularly - Review after every few matches to catch patterns early
- Look at all sections - Don't just focus on one metric; volleyball success is multi-dimensional
- Consider context - A decline in stats might mean you're playing tougher opponents, not necessarily playing worse
- Share with coaches - Use trends during coaching conversations to identify training priorities
- Compare seasons - Switch between seasons to see long-term development over multiple years
Troubleshooting
No data showing?
Make sure you have:
- Selected both a player AND a season
- Recorded at least one match for that player in that season
- A Pro or Coach subscription (Trend Analysis is a premium feature)
Consistency scores seem wrong?
Consistency calculations require multiple matches. If you only have 1-2 matches recorded, the consistency score may not be meaningful yet. Record more matches to get accurate consistency ratings.
Rolling averages not showing?
Rolling averages require a minimum number of matches:
- 3-match average needs at least 3 matches
- 5-match average needs at least 5 matches
- 10-match average needs at least 10 matches